Why Is Electricity So Expensive in California? (2026)
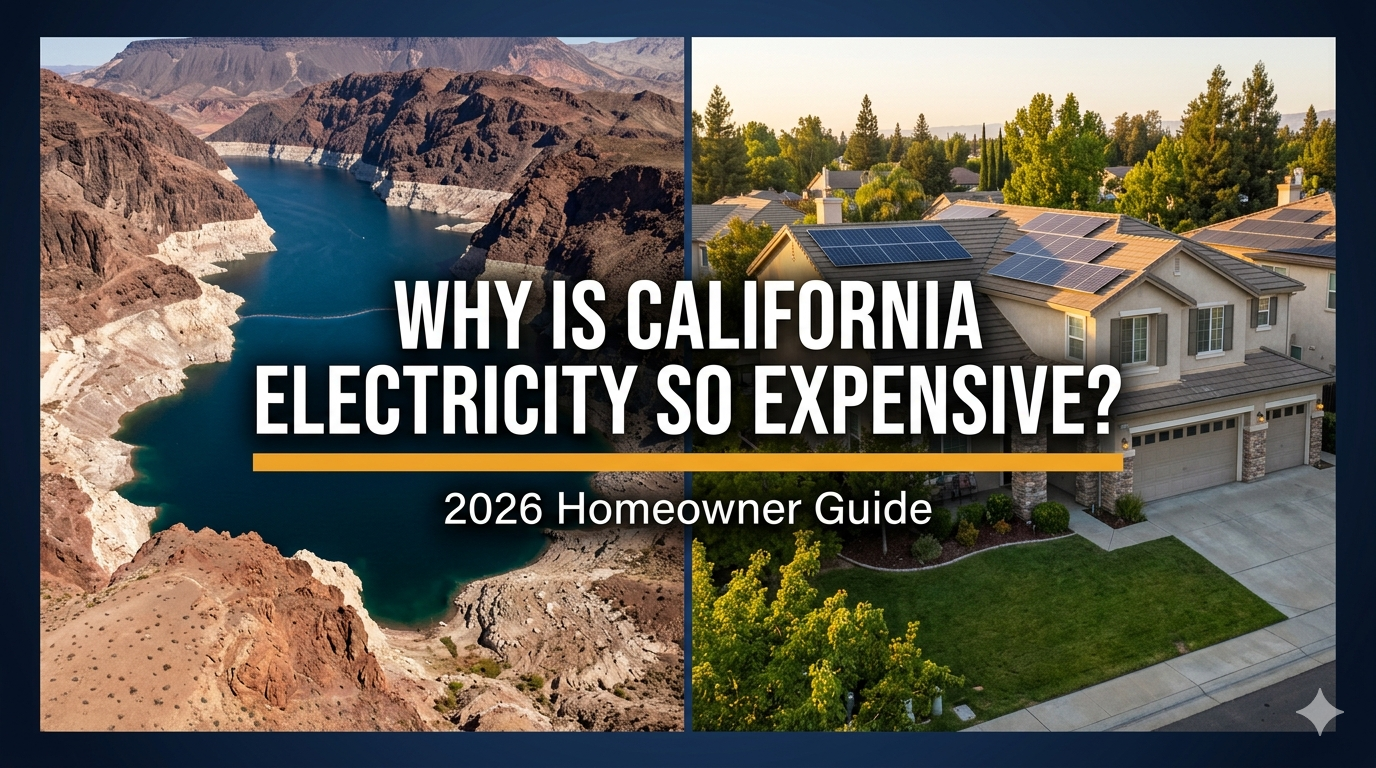
Electric Bill So High?
California electricity now averages about $0.34 per kWh — nearly double the U.S. average of $0.18. Six factors drive it: wildfire liability costs, grid rebuilding, clean energy mandates, drought-reduced hydropower, rising EV demand, and a rate structure that compounds every other cost. This guide breaks down all six with sourced data.
If your PG&E, SCE, SMUD, or SDG&E bill has climbed past $200, $300, or $400 a month — and you can't figure out why — you're not imagining it. This guide explains exactly where that money goes, what the next five years are likely to look like, and what homeowners can realistically do about it.
Enter your address — we'll pull your roof's solar potential and show you real savings numbers for your utility and rate plan.
Why Do Wildfire Costs Show Up On My Electricity Bill?
Wildfire liability costs are the single biggest driver of California's electricity rate premium — and most homeowners have no idea they're paying for it. Between 2019 and 2024, California's investor-owned utilities spent over $27 billion responding to wildfires, much of it caused by their own equipment, and every dollar gets recovered through your per-kWh rate.
PG&E alone filed for bankruptcy in 2019 under the weight of more than $30 billion in wildfire liability before emerging from reorganization in 2020. Every dollar spent on undergrounding power lines, vegetation management, replacing aging infrastructure in high fire-risk zones, Public Safety Power Shutoff (PSPS) infrastructure, and wildfire insurance eventually shows up embedded in your per-kWh rate — approved through the California Public Utilities Commission (CPUC).
Wildfire-related costs are not a one-time event. They are a structural, ongoing expense that California utilities will be recovering through rates for the foreseeable future. The recent decreases are real — they just don't change the long-term direction.
Why Is California Spending Billions to Rebuild Its Electrical Grid?
California's electrical grid was built for one-way power flow from large plants to homes. It is now being rebuilt from the ground up to handle solar flowing back from millions of rooftops, EVs charging every evening, heat pumps replacing gas furnaces, and large battery systems buffering supply and demand in real time — and every dollar of that transition is recovered through rates.
Each piece of that transition is a good idea for long-term energy costs. But the transition itself — new substations, smart meters, bidirectional infrastructure, and transmission lines — costs billions, and those costs are recovered through rates.
There's also a math problem unique to California: the state's mild climate and strict efficiency standards mean Californians use significantly less electricity per household than the national average. That means the same fixed infrastructure costs are spread across fewer kilowatt-hours sold — which pushes the per-kWh price higher even when total costs don't change.
How Much Is California's 2045 Clean Energy Mandate Adding to Bills Right Now?
Under SB 100, California must achieve 100% clean electricity by 2045 — and ratepayers are funding the buildout today. Utility-scale solar, offshore wind, grid-scale battery storage, and new transmission infrastructure are all being built now and recovered through your bill before any of the long-term savings materialize.
These investments will likely lower the long-run cost of electricity once natural gas fuel costs are replaced by zero-marginal-cost renewables. But right now, in the next 5 to 10 years, they add to rates before the savings materialize. That's the honest version of the clean energy transition cost story.
How Does the Drought and Hoover Dam Situation Affect My California Electric Bill?
What's Happening at Hoover Dam Right Now
On April 17, 2026, the U.S. Bureau of Reclamation announced an emergency plan that could reduce Hoover Dam's electricity output by up to 40% by fall 2026. Lake Mead is near its lowest level since 1937, the Colorado River system is at about 36% of total capacity, and five of the dam's 17 turbines are already offline.
How This Connects to Your California Bill
About 56% of Hoover Dam's power is allocated to California utilities — primarily Southern California Edison, the Los Angeles Department of Water and Power, and the Metropolitan Water District of Southern California, according to the U.S. Bureau of Reclamation. PG&E customers in Northern California don't receive Hoover power directly — but California's grid doesn't operate in silos.
When Southern California utilities lose access to Hoover's cheap hydropower — historically priced at $0.02 to $0.04 per kWh — they buy replacement power from the same CAISO wholesale market that every California utility participates in:
| Replacement Power Source | Approximate Cost |
|---|---|
| Hoover hydropower (being lost) | $0.02–$0.04/kWh |
| Natural gas peaker plants | $0.08–$0.15/kWh |
| Out-of-state power imports | $0.10–$0.18/kWh |
| Wholesale spot market (peak hours) | Variable — often higher |
What's True vs. What's Overstated
- Lake Mead at ~1,054 ft — near 1937 historic low
- Colorado River system at ~36% capacity
- 5 of 17 turbines already offline
- Up to 40% capacity cut possible by fall 2026
- Cheap hydro being replaced by costlier alternatives
- Hoover Dam is NOT shutting down
- Lake Mead is NOT running dry
- The grid is NOT failing
- This alone will NOT double your bill
- The dam still generates — at reduced capacity
The direct rate impact from Hoover alone is modest — estimated at 0.5¢ to 2¢ per kWh of additional pressure on California electricity costs. The bigger picture is that California's in-state hydro from Sierra Nevada reservoirs (Oroville, Shasta, Folsom) faces the same drought-driven volatility, forcing greater reliance on expensive backup sources statewide in dry years.
Why Is Electricity Demand in California Rising So Fast?
For decades, California's electricity demand was flat or declining. That changed — EVs, home electrification, and AI data centers are simultaneously adding massive new load to a grid that wasn't designed to handle it, and all of that new demand drives rates higher during the peak hours that hurt most.
Electric vehicles. California leads the nation in EV adoption. Most home charging happens between 5–10 p.m. — the same peak period when grid prices are already highest under time-of-use rate plans. CAISO has flagged EV charging as a primary contributor to the steepening evening demand curve as solar production drops off at sunset.
Home electrification. Heat pump water heaters, electric HVAC, induction cooktops, and electric dryers are replacing gas appliances under state incentive programs. Each one converts gas consumption into electricity consumption — adding kilowatt-hours both to household usage and to the grid's evening peak. Learn more on our all-electric home guide.
Data centers. AI infrastructure buildout has accelerated data center construction across Northern and Central California. These facilities run 24/7 at enormous scale, adding baseline load to the grid that simply didn't exist five years ago.
Why Does California's Rate Structure Make Every Cost Problem Worse?
California embeds almost all utility fixed costs into the per-kWh price rather than a flat monthly charge — which means every cost increase on the utility's books shows up directly as a higher price per kilowatt-hour on your bill, amplifying every other problem on this list.
In most states, utilities recover fixed costs through a flat monthly charge. In California, they've historically been almost entirely embedded in the volumetric rate. PG&E's March 2026 rate restructuring began shifting some costs into a new Base Services Charge (~$24/month) paired with a slightly lower per-kWh rate — a more honest structure, but one that adds a new fixed cost to every bill regardless of usage. SMUD customers in Sacramento face a similar dynamic under their own rate restructuring.
What Will a California Electricity Bill Look Like Over the Next 10 Years?
A household using 900 kWh per month — common for a 3- to 4-bedroom California home with central AC and one EV — is looking at this range across PG&E, SCE, and SDG&E territory:
The Math on Doing Nothing
| Scenario | Rate | Monthly | Annual | 10-Year |
|---|---|---|---|---|
| Today · statewide avg | $0.34/kWh | $306 | $3,672 | $36,720 |
| Today · PG&E E-TOU-C | $0.40/kWh | $360 | $4,320 | $43,200 |
| Today · SDG&E DR-SES | $0.47/kWh | $423 | $5,076 | $50,760 |
| Conservative 5-yr projection | $0.45/kWh | $405 | $4,860 | $48,600 |
| Higher 5-yr projection | $0.50/kWh | $450 | $5,400 | $54,000 |
Electric bills don't move like gas prices.
They ratchet up in 3–8% annual increments — sometimes with a small decrease that makes things feel like they're stabilizing. By the time a homeowner notices their bill has doubled compared to ten years ago, they've already paid the difference. There's no getting that money back. The window to lock in your cost of energy is widest before the next round of rate increases — not after.
What Can California Homeowners Actually Do to Lower Their Electricity Bill?
Three realistic options. Here's an honest look at each.
What Would Solar Actually Cut
From Your Specific Bill?
The table above shows statewide averages. Enter your address and monthly bill below — get a real savings estimate sized to your roof, your utility, and your rate plan. Takes 90 seconds.
Where is your home?
We use this to pull real roof and sun data for your exact address.
Your utility companyEstimates vary based on your roof, usage, and financing. A free site survey confirms everything.
Solar With Watts · California · CSLB #1065773 · Service Areas
Not all California utilities are equal. Here's how the math stacks up for a 900 kWh/month household across the four major territories — and why SDG&E and SCE customers have the strongest financial case for going solar right now.
| Utility | Avg Rate (2026) | Monthly Bill* | Est. Solar Savings/Mo | Best Option |
|---|---|---|---|---|
| SDG&E SDG&E | ~$0.47/kWh | ~$423/mo | $280–$360/mo | Solar + Battery |
| SCE SCE | ~$0.40/kWh | ~$360/mo | $230–$300/mo | Solar + Battery |
| PG&E PG&E | ~$0.40/kWh | ~$360/mo | $200–$280/mo | Solar + Battery |
| SMUD SMUD | ~$0.14/kWh | ~$126/mo | $80–$130/mo | Solar + Powerwall |
*Based on 900 kWh/month usage. Savings estimates assume solar + battery system optimized for NEM 3.0 self-consumption. Actual savings depend on roof orientation, shading, system size, and rate plan. †SMUD customers benefit from battery rebates up to $5,400/Powerwall — improving ROI significantly. Sources: PG&E E-TOU-C, SDG&E DR-SES, SMUD rate schedule, SCE TOU-D-PRIME.
Answer 3 quick questions to find out if your situation makes solar worth running the numbers on.
Every rate increase that hasn't happened yet is money still in your pocket — but only if you act before it does. The structural pressures covered in this guide are not abstractions. Several of them have specific near-term triggers on the CPUC's calendar.
None of this is meant to pressure you into a rushed decision — solar is a 25-year commitment and deserves careful evaluation. The point is that the math is better today than it will be in 12–18 months, and running the numbers now costs nothing.
Find Out What Solar Would
Actually Save You
Real savings estimate based on your roof, your bill, and your exact rate plan — PG&E, SCE, SMUD, SDG&E, or Pioneer. No pressure. Just numbers you can evaluate on your own time.
Serving PG&E, SMUD, SCE, SDG&E, and Pioneer Community Energy territories across California — Sacramento, Stockton, Fresno, Visalia, Bakersfield, Folsom, El Dorado Hills, Chula Vista, Escondido, and surrounding communities.
What Do California Homeowners Most Want to Know About High Electricity Bills?
The questions we hear most from PG&E, SCE, SMUD, and SDG&E customers — answered directly.
- U.S. Bureau of Reclamation — Hoover Dam Power FAQ
- Bureau of Reclamation — April 2026 24-Month Colorado River Study
- PG&E — Residential Electric Rate Information
- CPUC — California Electric Rates Overview
- California Energy Commission — Hydroelectric Power
- U.S. EIA — California Hydroelectric Generation
- SEIA — California Energy Affordability Analysis
- ElectricChoice — Electricity Rates by State, April 2026
- SDG&E — Residential Rate Schedules
- SMUD — Residential Rate Information